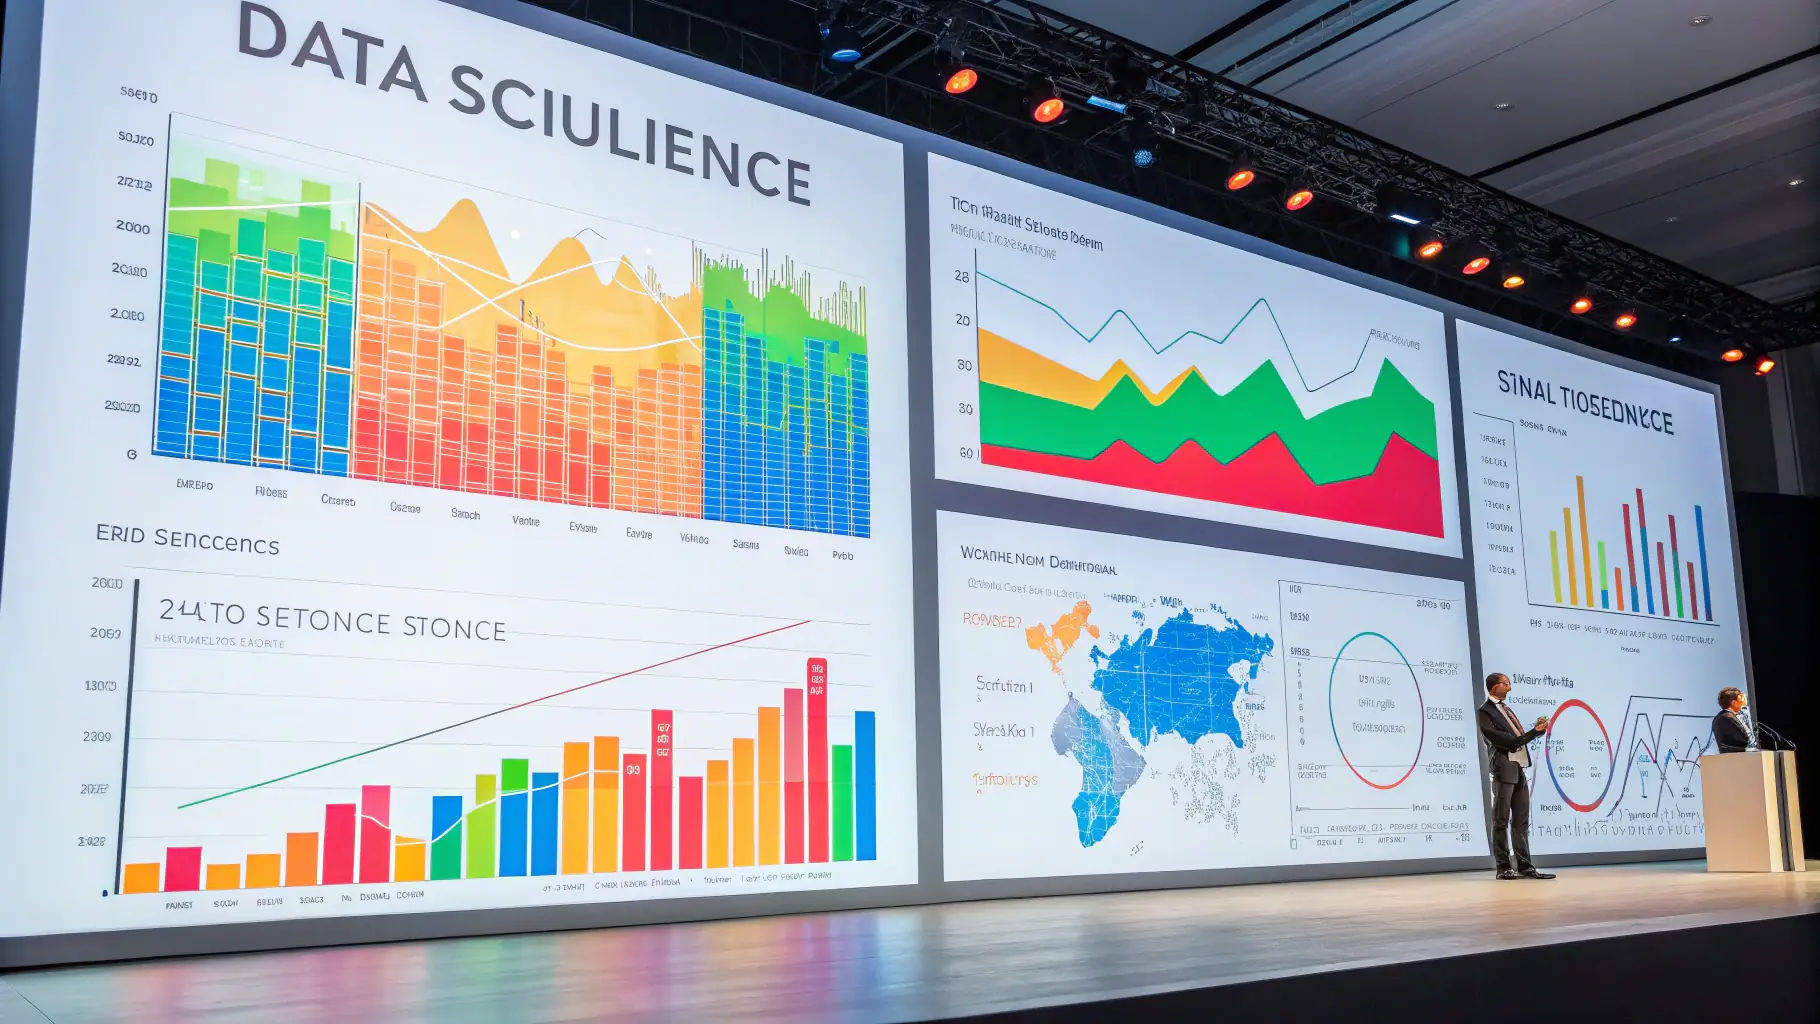
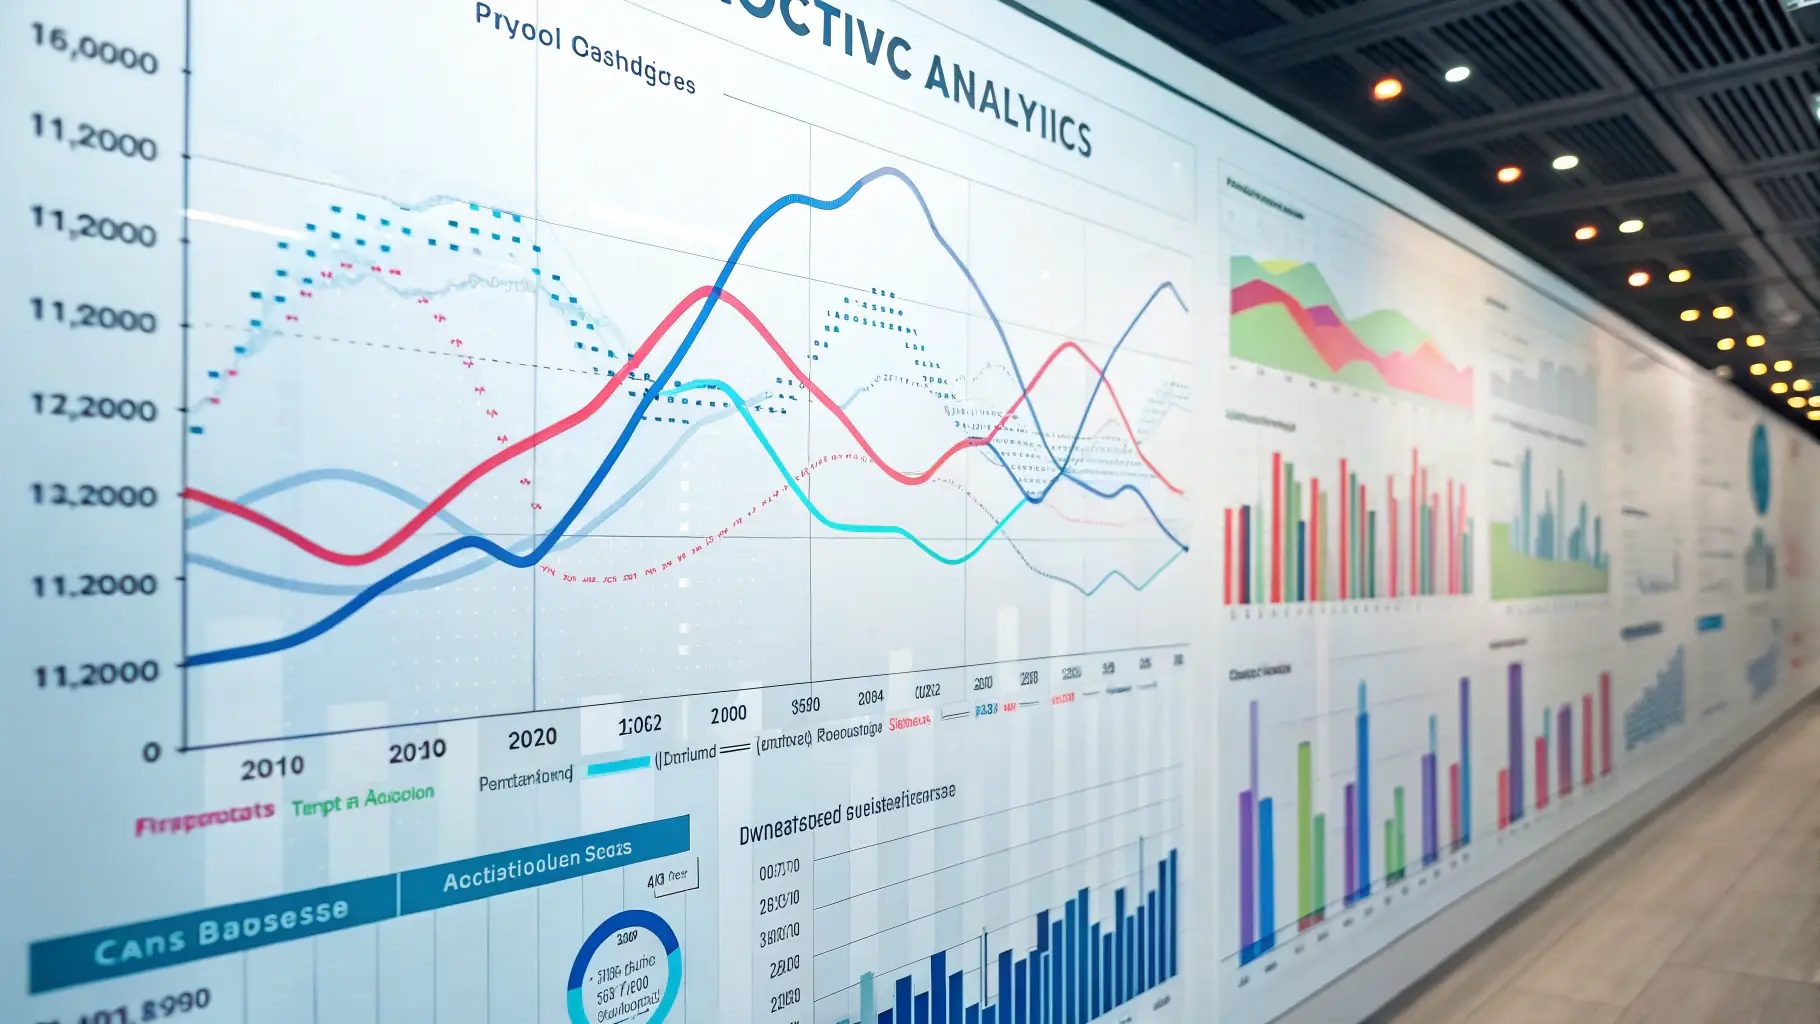
Data visualization is a powerful tool for transforming complex data into easily understandable insights. By presenting data in graphical formats, businesses can quickly identify patterns, trends, and outliers that might otherwise be missed. This visual representation of data allows for more effective communication and collaboration among stakeholders, fostering a shared understanding of the information. Visualizations can be used to highlight key performance indicators (KPIs), track progress towards goals, and identify areas for improvement. Choosing the right visualization technique is crucial for effectively communicating insights. Different types of charts and graphs are suited to different types of data and objectives. For example, bar charts are ideal for comparing categories, while line charts are effective for illustrating trends over time. Understanding the strengths and limitations of each visualization technique is essential for creating impactful and informative presentations. Data visualization tools and software are readily available to assist in the creation of compelling visuals. These tools often provide templates, pre-built visualizations, and interactive features that allow users to customize and explore data in various ways. By leveraging these tools, businesses can create engaging and informative dashboards, reports, and presentations that effectively communicate their findings and support data-driven decision-making.

The Importance of Data Security in Business
Data security is paramount for businesses operating in today’s digital landscape.


